On Friday, October 3, the U.S. Bureau of Labor Statistics (BLS) did not publish the September Employment Situation Summary report. The monthly “jobs report” provides policymakers, businesses, and the public with the most rigorous and timely employment data on the labor market. The absence of official data comes at a crucial time, as several Trump administration policies—including immigration enforcement, chaotic tariffs, and federal workforce cuts—have heightened uncertainty about the current labor market. The suspension of all BLS activities related to labor market data is unnecessary and harms the economy as it delays vital information about the labor market. These data delays can lead economic actors (e.g., the Federal Reserve, Congress, investors, and employers) to fall behind the curve of economic events and hence make suboptimal decisions.
During the last federal shutdown in 2018–2019, the BLS did not suspend its activities and released its employment situation report as normal. In fact, this is the first time in 12 years that an employment situation report was delayed.1 In addition, the BLS is meant to start collecting data for the October employment report next week. If the shutdown continues, it’s possible that, for the first time in at least six decades, there will be a full month gap in data about jobs and unemployment in the U.S. economy. While nongovernment datasets can provide some limited insights into employment levels, none can replicate the supply side of the labor market, which is particularly important as immigration flows have slowed dramatically. In short, the shutdown (and potentially the attempted politicization of key government data-collection agencies) could leave policymakers flying blind just as the economy encounters real turbulence.
Fortunately, there is one government dataset—collected at the state level—that still offers a useful and up-to-date read on one key angle of the labor market: unemployment insurance claims records. Every week, the Department of Labor’s (DOL) Unemployment Insurance (UI) Weekly Claims News Release tells us how many people filed for unemployment insurance (initial claims) and how many people received unemployment insurance benefits (continued or insured unemployment).2 These data are reported separately for regular state programs, federal programs, and other smaller categories. Because of the government shutdown and ceased activities, DOL has stopped releasing the Weekly Claims News Release (the last one was on September 25). However, each state’s labor department has continued to collect the information and by and large these data are available on the DOL website for researchers to access.3 Therefore, we here at EPI have continued to analyze the present the data on EPI’s Unemployment Insurance Claims landing page.
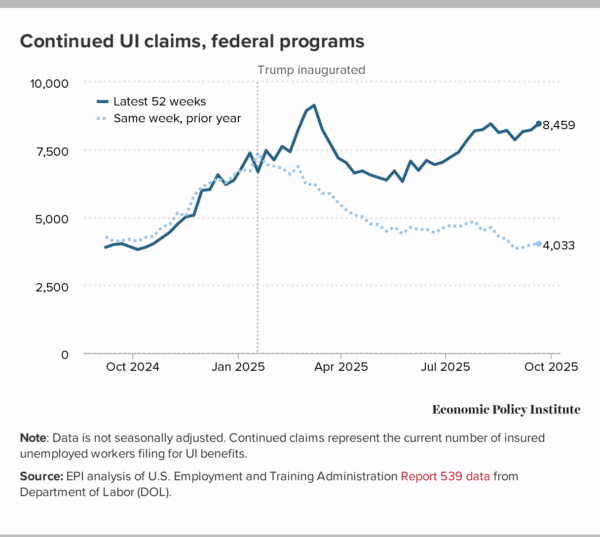
The fingerprints of Trump policy decisions are most clearly found in the distinct rise in federal claims—claims filed specifically by workers laid off from federal agencies. However, we are also seeing troubling trends in UI claims in regular state programs, particularly in the Washington, D.C., metropolitan area. Figure A illustrates continued (insured) unemployment insurance claims for federal workers now compared with the same week in the prior year. The latest data show significantly higher continued unemployment insurance claims for federal workers than this time last year: Nearly 8,500 claims the week ending September 20, 2025, compared with only about 4,000 claims the same week in 2024. Claims are more than double what they were a year ago. The figure clearly shows when the divergence in trend began.

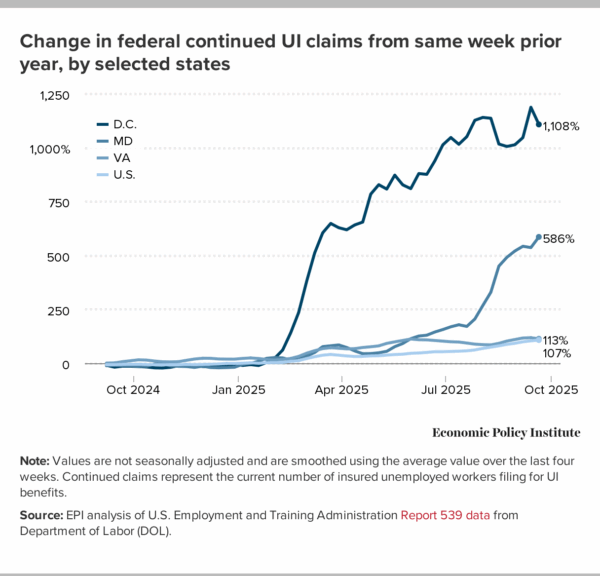
Not surprisingly, those federal layoffs and subsequent federal UI claims are felt more acutely in the Washington, D.C., metro area. For these numbers (as shown in Figure B), we construct four-week moving averages, compared with the same four weeks in the prior year, to smooth out some volatility in the data. In D.C. proper, federal continued claims increased over 1,000% from the same time last year. In nearby Maryland, federal claims are up over 500% and federal claims in Virginia are double compared with the same period in 2024.

With thousands of workers leaving federal payrolls on September 30, we expect these numbers to continue to climb in the coming weeks. According to Office of Personnel Management (OPM) Director Scott Kupor, 2025 will end with 300,000 fewer federal workers. There are some signs that economic weakness has extended beyond the federal workforce. In the latest jobs report released, payroll employment growth has slowed dramatically, the hires rate has softened, and Black and young adult unemployment rates have ticked up over the last several months.
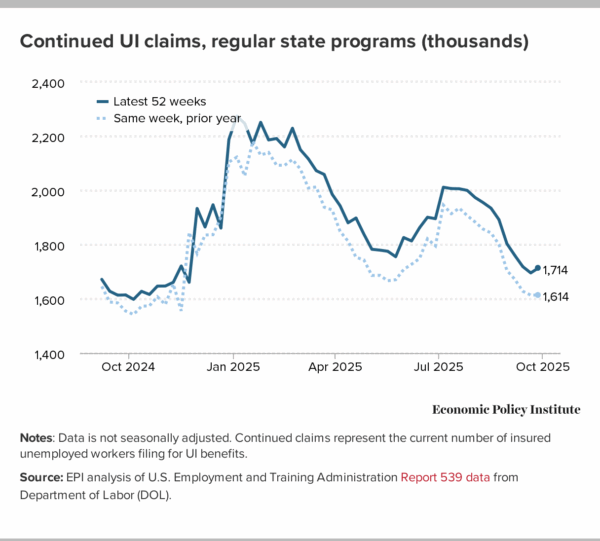
So far, the continued regular state claims (excluding federal workers) are only up slightly from last year. Over the last three months, continued claims have averaged 90,000 higher than those the same period last year (about a 5% increase), but that’s not unusual so it remains more an indicator to watch rather than anything alarming at this point in time. Figure C shows continued UI claims now compared with the same time last year. Given seasonality in these data, it’s useful to compare year over year to identify trends. If the level of claims continues to break away from last year, it will mean we may be heading toward an even weaker labor market.

While the national numbers of continued UI claims are not yet showing up as recessionary, there are clearly pockets of this country that are experiencing greater labor market weakness. For example, year-over-year percentage increases in continued claims for the District of Columbia, Virginia, and Maryland are 53%, 29%, and 25%, respectively. These states represent three of the five highest year-over-year increases, with Connecticut (47%) and Oregon (27%) being the other two states according to the latest data for the week ending September 27, 2025.
UI claims are essentially a signal about the pace of layoffs in the labor market. Increased layoffs would obviously signal a deteriorating labor market, but there are clearly ways for labor markets to weaken substantially even before large increases in layoffs. For example, if firms largely avoid layoffs but significantly reduce new hiring, then unemployment will rise as new labor market entrants fail to secure employment. Hence, as valuable as UI data are, they only give us one angle of potential labor market weakness. For the 360-degree view of the labor market needed to make informed policy decisions, the federal statistical agencies need to come back online and be allowed to do their work with ample resources and free of any political interference.
All the data above and more will be updated weekly every Thursday on EPI’s new UI claims landing page. UI data will continue to play an important role throughout the government shutdown and serve as one of the timeliest indicators of the labor market moving forward. Hopefully, vital BLS workers will be called back to work as soon as possible to collect and process data for the monthly jobs report so we don’t miss an entire month’s worth of essential complementary labor market data.
Notes
1. During the October 2013 federal shutdown, the September employment situation report was delayed 18 days and was released six days after the shutdown ended. The subsequent October report was released seven days late due to delays in data collection. During the 1995–1996 federal shutdown, the December report came out 14 days late on January 19, 1996. These are the only three occurrences of delays in the BLS employment situation report due to federal shutdowns.
2. Unemployment insurance receipt should not be confused with a count of the unemployed, which is measured as workers without a job who are actively seeking work through a separate BLS survey. To be counted among those with continued (or insured) unemployment insurance, a claim has to be filed and approved. The recipiency rate— the insured unemployed in regular programs as a percentage of the total unemployed—is only 27% nationwide, which means the count of workers receiving unemployment insurance misses most unemployed workers.
3. There have been some minor exceptions and minor delays in reporting. For instance, Massachusetts and Arizona were released with a delay two weeks ago, but then the data was eventually filled in. For last week’s data, Massachusetts was still missing but we were able to input the data straight from the MA Department of Economic Research website. Hawaii and Virgin Islands also had missing data for the latest release so we imputed using data from the prior week. Our state analysis is done on a four-week moving average to smooth out some volatility so this imputation is likely not a large assumption to the trends we are seeing.


