The D.C. Council is debating watering down or eliminating Initiative 82 (I-82), a law passed overwhelmingly by D.C. voters in 2022 that gradually phases out the subminimum wage for tipped workers through 2027. The D.C. Council has already postponed wage increases for tipped workers this year, delaying a scheduled July increase to October.1 Further actions interfering with I-82 will deny this group of low-wage workers vital wage gains and economic security in one of the highest cost-of-living metro areas in the country.
Who are D.C. tipped workers?
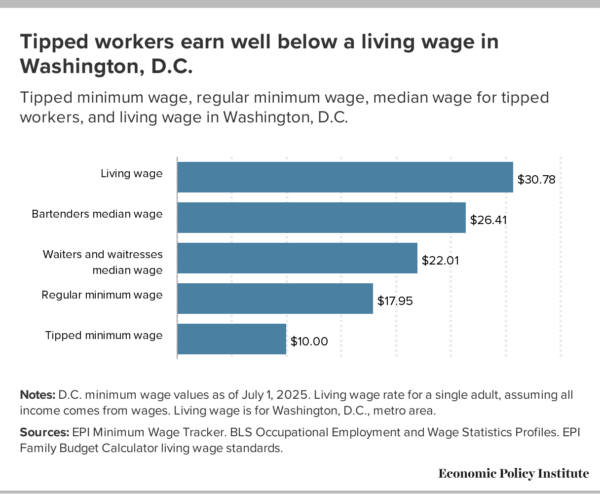
Tipped workers include waiters, bartenders, barbers, hairdressers, and other workers who customarily and regularly receive tips. The subminimum tipped wage allows employers to pay these workers a lower base wage than the regular minimum wage, so long as the worker earns the remainder via tips. As of July 2025, the regular minimum wage in D.C. is $17.95 and the tipped minimum wage is $10 an hour—just over half of the regular minimum wage. Employers are legally required to ensure that, on a weekly basis, workers’ tips cover the gap between the tipped minimum wage and the regular minimum wage for the total hours worked that week. If there is a gap, employers are responsible for making up the difference. In practice, this requirement is exceptionally difficult to enforce; it is largely left to workers themselves to track their hours and tips, make the relevant calculations, and then confront their employer over any discrepancy. As a result, tipped workers are particularly vulnerable to wage theft.
This two-tier system in minimum wage policy exists in federal minimum wage law, as well as most states across the country. However, seven states (Arkansas, California, Minnesota, Montana, Nevada, Oregon, and Washington) have long had a single minimum wage floor for all workers.
There are approximately 12,200 tipped workers in D.C.,2 representing a diverse group of working people in the area. Tipped workers are majority women. Nearly a third (32.4%) of tipped workers in D.C. are Black, 29.9% are Hispanic, a quarter (25.0%) are white, and one in ten (10.0%) are AAPI.3
These workers must make ends meet in one of the most expensive areas in the nation. According EPI’s Family Budget Calculator, a two-adult, two-child family in the D.C. metro area must annually earn $139,524 to sustain a modest but adequate standard of living. For a single adult with no children, living costs are around $64,000 a year. Figure A shows that if we translate these overall living costs into an hourly living wage, a single adult working full time would need to earn $30.78 an hour to sustainably cover all their living needs.4

Tipped workers in D.C. typically earn well below this living wage mark. According to Bureau of Labor Statistics (BLS) Occupational Employment and Wage Statistics, the median hourly wage (including tips) in D.C. is $22.01 for waiters and $26.41 for bartenders. With half of workers in these occupations earning less than these median figures, it is no surprise then that tipped workers experience poverty at much higher rates than the overall workforce. Among tipped workers in D.C., 7.7% are in poverty compared with 2.6% of non-tipped workers, meaning poverty is almost three times more prevalent among tipped workers than non-tipped workers.5 This economic hardship underscores the need to fully implement I-82 and lift wages for these workers.
There is little evidence that increasing tipped wages is hurting the D.C. restaurant industry
Justifications for changing or eliminating I-82 have centered around the industry-backed narrative that the D.C. restaurant industry is in crisis. Significant economic shocks in recent years have indeed likely affected restaurants in the District, including consumer spending changes after the pandemic, price increases on key costs like food and rent, and instability and potential declines in regional consumer spending produced by the Trump administration’s attacks on federal workers. Coinciding with these challenges, the implementation of I-82 began in May 2023 (when the tipped minimum rose from $5.35 to $6.00), with further increases to the tipped minimum wage in July 2023 ($8.00) and July 2024 ($10.00). However, an examination of the best available public data on the restaurant industry during this period reveals little to no evidence that increasing the tipped minimum wage has caused measurable harm to industry employment or business growth. If anything, D.C.’s restaurant industry has done well relative to most jurisdictions over this period.
The following analysis uses data from the BLS Quarterly Census of Employment and Wages (QCEW), which contains data on employment, number of establishments, and wages based primarily on employer reporting to state unemployment insurance programs.6 The QCEW allows for deep analysis of these key economic indicators by industry and geography, but the most recent data available is from the fourth quarter of 2024. Notwithstanding this lag, the QCEW still offers more than a year of data from full-service restaurants in D.C. since the implementation of I-82 in May 2023. This analysis compares the four quarters before the beginning of the policy (2022Q2 to 2023Q1) with the most recent year of data available (2024Q1 to 2024Q4). A full year of data is included to account for seasonal variations in employment in the restaurant industry. We compare trends in the private full-service restaurant industry (NAICS 722511) in Washington, D.C., with all other DMV area jurisdictions, the U.S. overall, and the average of the top 50 largest counties by total private employment.7
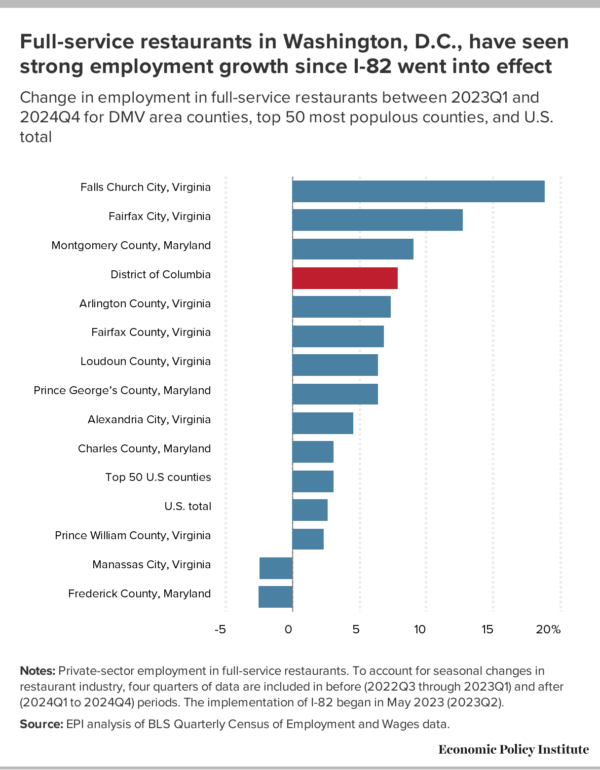
Employment growth in the restaurant industry has been strong since the implementation of I-82. As Figure B shows, employment in full-service restaurants in DC grew 7.9% between the year before the implementation of I-82 and the most recent year of data available (2024). The industry’s employment growth is greater than for all private employment in D.C. (1.0%).8 D.C. restaurant employment growth is stronger than most other jurisdictions in the DMV area. It is also well above restaurant employment growth in the U.S. overall (2.7%) and the average of the top 50 most populous counties in the nation (3.1%).

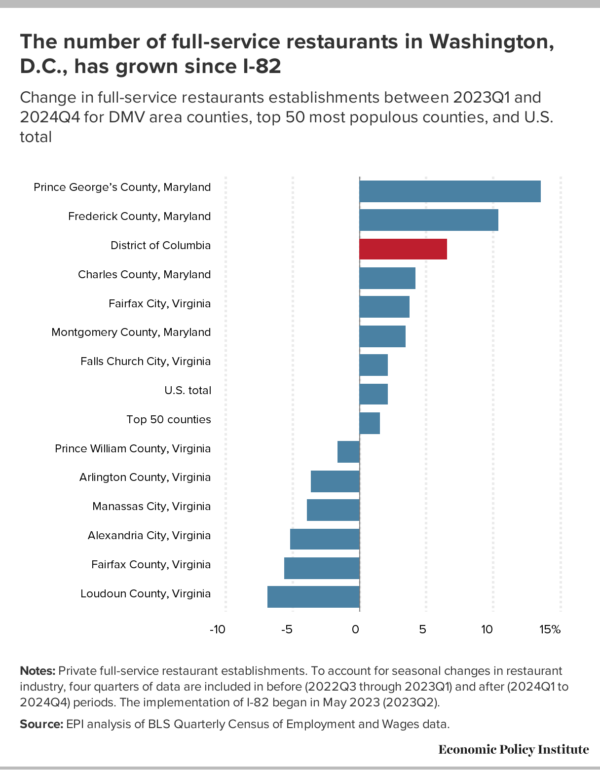
Similarly, Figure C shows that full-service restaurant establishment growth has been strong compared with other DMV areas and the nation overall. The number of restaurant establishments in D.C. grew 6.6% between the two periods, the third highest growth rate of any DMV jurisdiction. This figure well exceeds the U.S. overall (2.2%) and the large county average (1.6%). The median lifespan of a restaurant business is around 4.5 years, so there will always be significant churn in the industry, but D.C.’s overall number of restaurants has grown since I-82’s implementation.

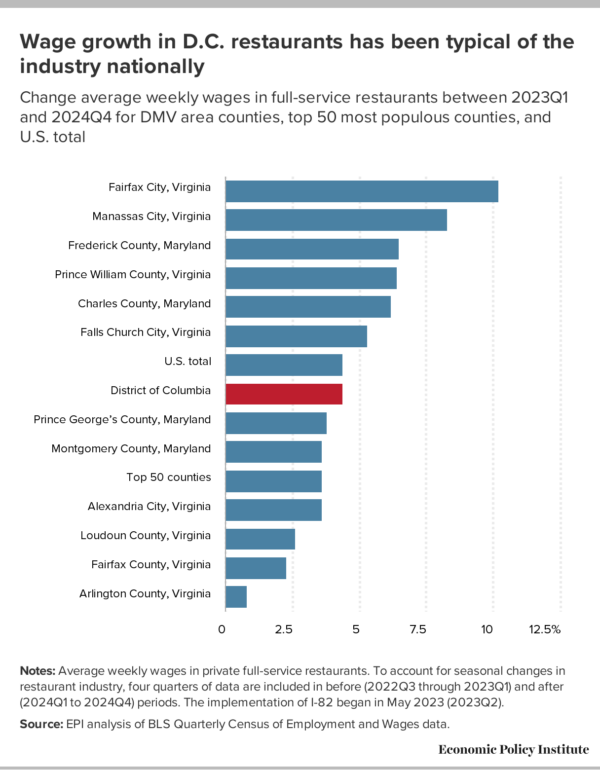
Finally, Figure D shows trends in average weekly wage growth in full-service restaurants. The QCEW data shows a modest 4.4% nominal wage growth in D.C. between the two time periods, equivalent to the U.S. average and slightly above the average for the 50 most populous counties. This wage growth is also middle-of-the-road compared with the wage growth in other jurisdictions in the DMV. Since these data report the average wage growth for all employees, they could disguise stronger wage growth for lower earners who are more likely to be impacted by the minimum wage increases in D.C.9 The majority of minimum wage studies continue to find that increasing the minimum wage lifts earnings for affected workers, including in the restaurant industry.

The QCEW data provide no reason to believe that the restaurant industry in D.C. is struggling since I-82 went into effect compared with its peers in the DMV and across the country. On the contrary, D.C. restaurants’ employment and business growth are strong. Although conditions may have changed since 2025, analyses using 2025 data also affirm the restaurant industry is in good health.
These findings are further supported by economic studies that consistently find that increasing the minimum wage produces wage benefits for workers without significantly increasing unemployment. Furthermore, the seven states without a tipped minimum wage continue to have successful restaurant industries. In these states, tipped workers have lower poverty rates and higher take home pay.
Another narrative surrounding I-82 is that increasing the tipped minimum wage hurts small businesses in particular. The QCEW data do not allow us to analyze industry changes by employment size; however, it is notable that before the pandemic, D.C. had a smaller share of small businesses (defined as those with fewer than 20 employees) in its restaurant industry than New York City, San Francisco, Seattle, and the overall U.S. average. Less than half of D.C. restaurants had 20 or fewer employees, compared with 63.2% of restaurants nationwide. The dominance of larger establishments in D.C.’s restaurant industry cannot be attributed to increases in the tipped minimum wage.
The economic data offers no justification for denying wage increases for tipped workers which were supported by almost three-quarters of D.C. voters. We have examples of successful restaurant industries in cities in California, Minnesota, Nevada, and more. It is abundantly clear that the current wages for tipped workers are too low to sustainably earn a living in D.C. The complete implementation of I-82 is vital for ensuring the economic security of these workers.
1. The D.C. Council has previously interfered with efforts to increase the tipped minimum wage. In 2018, the Council repealed Initiative 77, a measure passed by D.C. voters to eliminate the tipped minimum wage.
2. EPI analysis of American Community Survey data. Estimate is based on total number of workers in occupations known to commonly practice tipping.
3. AAPI stands for Asian American and Pacific Islander.
4. Living wage assumes all income comes from wages.
5. EPI analysis of American Community Survey 5-year 2023 data.
6. All private employers must submit a Quarterly Contributions Report to their state governments as part of their state unemployment insurance programs.
7. Other DMV jurisdictions: Alexandria City, VA, Arlington County, VA, Charles County, MD, Fairfax City, VA, Fairfax County, VA, Falls Church, VA, Frederick County, MD, Loudoun County, VA, Manassas City, VA, Montgomery County, MD, Prince George’s County, Prince William County, VA.
8. Employment growth for all private employment in D.C. based on EPI analysis of QCEW data. Trends in total private employment are not included in figures.
9. Average weekly wages data in the QCEW are calculated by dividing the quarterly total of wages by the average number of employees in that quarter. Wage data include payments like bonuses, tips, and other gratuities.


