Recent natural disasters have renewed concerns about insurance markets for natural disaster relief. In January 2025, wildfires wreaked havoc in residential areas outside of Los Angeles. Direct damage estimates for the Los Angeles wildfires range from $76 billion to $131 billion, with only up to $45 billion of insured losses (Li and Yu, 2025). In this post, we examine the state of another disaster insurance market: the flood insurance market. We review features of flood insurance mandates, flood insurance take-up, and connect this to work in a related Staff Report that explores how mortgage lenders manage their exposure to flood risk. Mortgages are a transmission channel for monetary policy and also an important financial product for both banks and nonbank lenders that actively participate in the mortgage market.
Flood Damages and Insurance Coverage
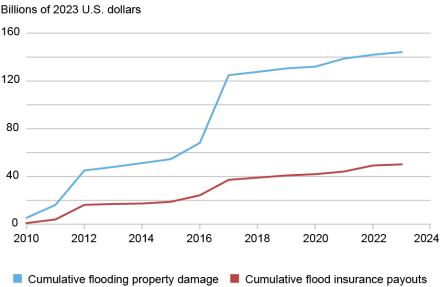
The U.S. has sustained substantial and largely uninsured damages from flooding over the past fifteen years. The chart below displays the cumulative damages from flooding in the U.S. and the cumulative insurance payouts on these damages, starting in 2010. Between 2010 and 2023, the direct property damage from flooding totaled nearly $144 billion (in 2023 USD). In the same period, insurance payments on property damage from the National Flood Insurance Program totaled approximately $50 billion (in 2023 USD)—just 35 percent of the direct damages. These damage estimates understate the full economic cost of flooding by excluding indirect damages (for example, lost income and production associated with floods).
Cumulative Flood Damages and Insurance Payments, 2010‑23

Notes: Both damages and insurance payments considered are restricted to those in the fifty states and District of Columbia, excluding damages and claims in U.S. territories.
Insurance Mandates
What does the flood insurance market look like and who has to purchase flood insurance? Flood insurance in the U.S. is almost exclusively provided through the National Flood Insurance Program (NFIP), which is managed by the Federal Emergency Management Agency (FEMA). In its role administering the NFIP, FEMA designates special areas with elevated flood risk, known as 100-year flood zones. A 100-year flood zone is a FEMA-designated area with an annual probability of experiencing a major flood of at least 1 percent (that is, at least one major flood is expected every 100 years). With little exception, flood insurance is required to obtain a mortgage for a property in 100-year flood zones—areas that cover roughly 5 percent of residential properties.
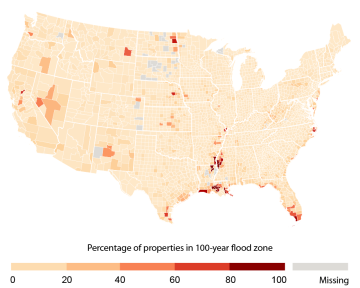
Although these flood-prone areas are mostly concentrated in coastal and riverine areas, smaller pockets exist across the country. The chart below shows the county-level proportion of properties covered by a 100-year flood zone for the contiguous states. Nearly 20 percent of all properties located in one of FEMA’s 100-year flood zones are located within one mile of the coast, but the majority are located further inland—approximately 60 percent of properties inside a 100-year flood zone are located more than ten miles from the coast.
County-Level Percent of Properties in a 100-year Flood Zone

Corresponding with updates in the NFIP’s pricing structure, flood insurance prices are on the rise. From 2009 to 2023, the mean annual cost of a flood insurance policy for a single-family home increased by 82 percent—an average annual growth rate of approximately 4.4 percent. At the same time, flood insurance coverage has fallen. There were nearly 900,000 fewer active flood insurance policies in 2023 than in 2009, an approximately 16 percent drop over the period.
Risk and Insurance Take-Up
Despite the virtually mandatory nature of flood insurance inside a 100-year flood zone, most flood damages are not insured, partly because of the prevalence of flood risk outside of official flood zones.
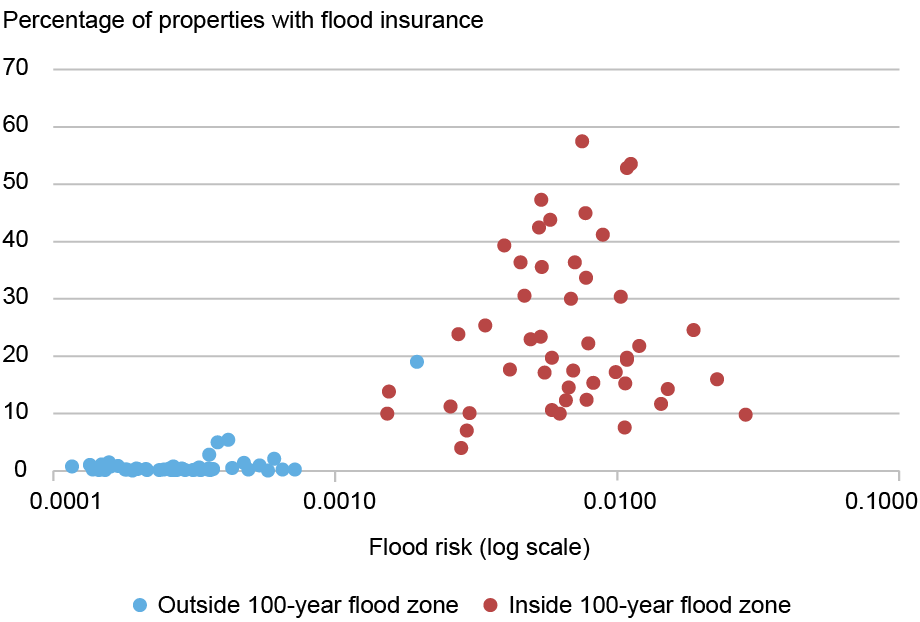
Properties outside an official 100-year flood zone can still purchase flood insurance from the NFIP, but this is quite rare in practice. Both underlying flood risk and the presence of a flood insurance mandate are important drivers of flood insurance adoption. The chart below looks at the relationship between flood risk, flood mandates, and flood insurance adoption. For each of the contiguous forty-eight states, we compute the average flood risk and flood insurance take-up rates for properties inside a 100-year flood zone (red) and outside a 100-year flood zone (blue). Not all properties inside a 100-year flood zone have flood insurance, either because they do not have a mortgage or because they have fallen out of compliance. On average, properties in official flood zones are exposed to high flood risk relative to properties outside of official flood zones—the exception being Louisiana, where even the average property outside of an official flood zone faces high flood risk. Also, flood insurance is more common in areas (1) where the average flood risk is high, and (2) subject to the insurance mandate.
Flood Risk and Insurance Take-Up, In and Out of Flood Zones

Notes: A point on the plot represents a state-flood zone combination. Flood risk in a state-flood zone is computed as the unweighted mean of properties’ average annual loss (AAL) as a proportion of their insurable value, as estimated by CoreLogic.
At the state-level, it is difficult to identify if flood zone designations have any meaningful impact on insurance take-up or whether the higher insurance take-up rates are driven purely by higher flood risk. Using more granular data in our own analysis, we find a significant difference in flood insurance take-up across flood zones: a property outside a 100-year flood zone is 15 percentage points less likely to have flood insurance than a property inside a flood zone, even when we control for local measures of flood risk.
Implications for Mortgage Lending
What are the implications of uninsured flood risk for financial intermediaries and the mortgage market? In the associated Staff Report, we explore to what extent mortgage lenders have responded to flood risk for loans secured by properties outside an official flood zone. We find that in the aggregate, mortgage lenders are aware of flood risk outside of official flood zones. For instance, mortgage lenders have lower mortgage origination rates for homes with moderate-to-high flood risk outside FEMA’s official flood zones, relative to otherwise comparable homes with low-to-no flood risk and also located outside FEMA’s official flood zones. Not all lenders respond in the same way though. Large banks have managed their exposure by reducing their originations while non-banks have done so by selling and securitizing these mortgages. Consistent with this fact, we document higher growth rates for non-banks’ market share in high-flood risk census tracts than low-flood risk census tracts.
Final Words
In this post, we have emphasized that (1) substantial flood risk exists even for properties outside of the mandated insurance areas, and (2) there are significant differences in flood insurance take-up between properties inside and outside the mandated insurance areas. Mortgage lenders are aware of this predominantly uninsured flood risk and have taken actions to manage their exposures.

Kristian Blickle is a financial research advisor in the Federal Reserve Bank of New York’s Research and Statistics Group.

Evan Perry, a former research analyst in the Federal Reserve Bank of New York’s Research and Statistics Group, is a Ph.D. student in Environmental Economics at Yale University.

João A.C. Santos is a financial research advisor in the Federal Reserve Bank of New York’s Research and Statistics Group.
How to cite this post:
Kristian S. Blickle, Evan Perry, and João A.C. Santos, “Flood Risk and Flood Insurance,” Federal Reserve Bank of New York Liberty Street Economics, August 7, 2025, https://libertystreeteconomics.newyorkfed.org/2025/08/flood-risk-and-flood-insurance/.
Disclaimer
The views expressed in this post are those of the author(s) and do not necessarily reflect the position of the Federal Reserve Bank of New York or the Federal Reserve System. Any errors or omissions are the responsibility of the author(s).


