Quick Summary:
This 2025 update lists the 10 most polluted rivers in the world, based on toxic discharge, ecological damage and human impact. From the Ganges in India to the Citarum in Indonesia, these rivers show us why we need global water reform now.
Why River Pollution Still Matters in 2025
Rivers are the lifeblood of our planet, carrying freshwater, nutrients and life across continents. Yet today, over 2.5 billion people rely on rivers that are getting more toxic. According to the UN, 80% of wastewater globally is released untreated into natural water bodies, most of it ends up in rivers.
Polluted rivers don’t just harm fish or water clarity – they:
- Destroy entire aquatic ecosystems.
- Contribute to global warming through methane emissions.
- Spread waterborne diseases to millions.
- Undermine food security for communities that rely on river-based agriculture.
Methodology: How We Ranked the Most Polluted Rivers in 2025
This list was compiled using reports from:
- UNEP, WWF, World Bank
- National environmental protection agencies
- Peer-reviewed studies from journals like Environmental Pollution and Water Research
Key Factors Considered:
| Criteria | Weight |
| Levels of chemical & biological pollutants | 35% |
| Impact on local communities and health | 25% |
| Plastic waste density (kg/km²) | 15% |
| Loss of biodiversity | 15% |
| Clean-up efforts and reversibility | 10% |
The 10 Most Polluted Rivers in the World (2025 Ranked)
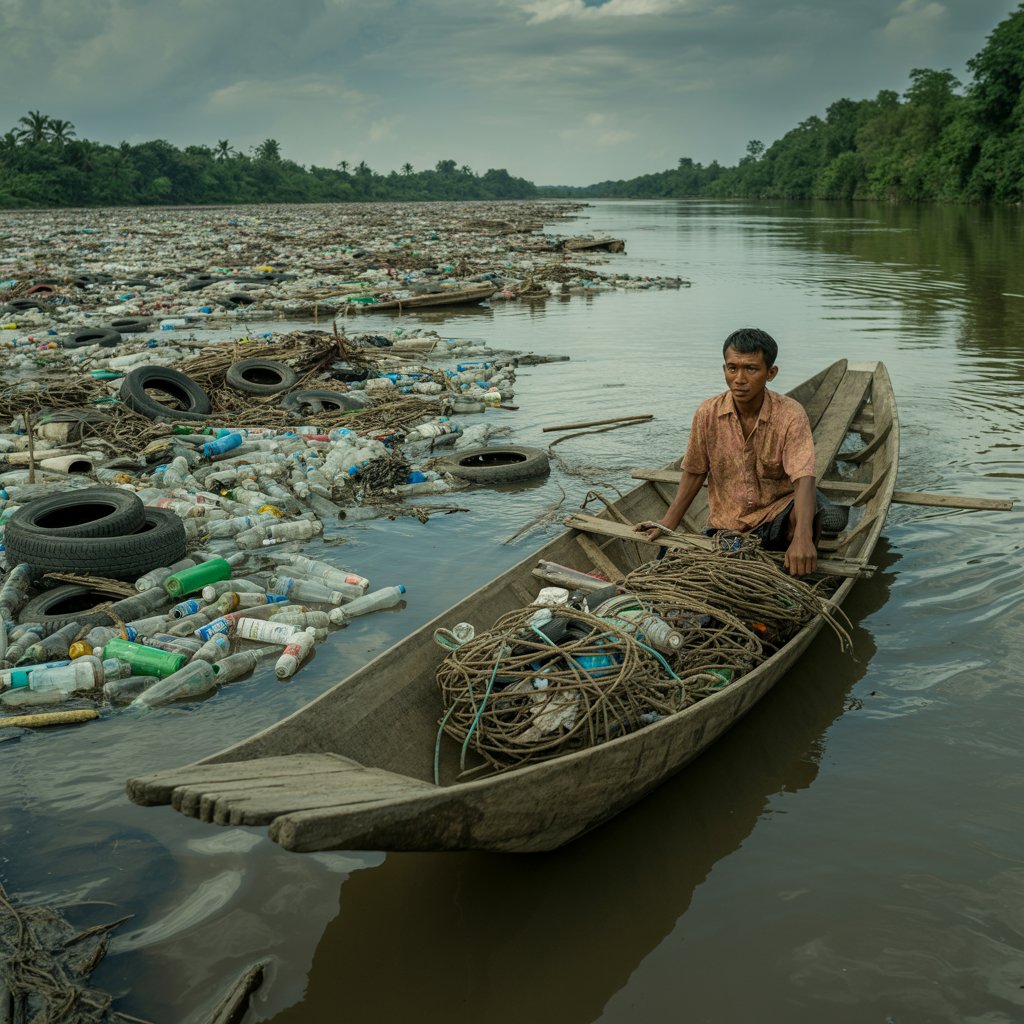
1. Citarum River – Indonesia
- Length: 300 km
• Main Pollutants: Mercury, cadmium, lead, textile dyes
• Source: Over 2,000 unregulated textile factories in West Java
• Affected Areas: Bandung, Bekasi, Karawang
• Impact: High mercury levels detected in schoolchildren; rice paddies yield stunted, contaminated crops
• Historical Note: Once a sacred agricultural artery in Sundanese culture
• Notable Fact: Over 20 million people rely on this river for water—most boil or import bottled alternatives
Update 2025: The Citarum Harum initiative removed 3,200 tons of surface waste last year, but illegal discharges remain unchecked due to limited enforcement.
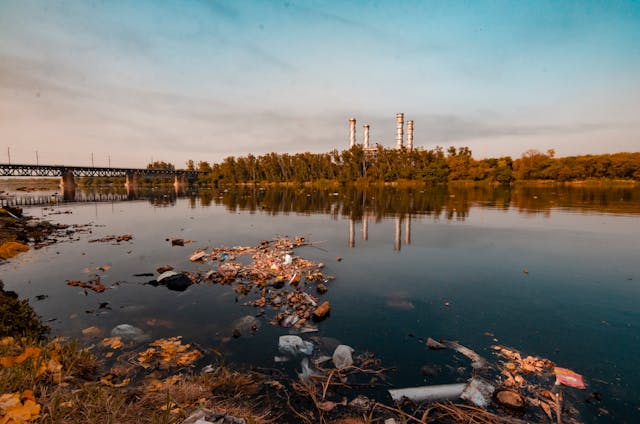
2. Ganges River – India
- Length: 2,525 km
• Main Pollutants: Raw sewage, plastic debris, chemical effluents
• Source: Urban and rural runoff from 500+ million residents
• Affected Areas: Varanasi, Patna, Kanpur, Kolkata
• Impact: Cholera and hepatitis outbreaks are endemic; religious rituals continue in waters deemed “unsafe for bathing” by the CPCB
• Historical Note: Central to Hinduism, life, death, and pilgrimage
• Notable Fact: Cremation ashes and industrial dye waste co-mingle in sacred bathing ghats
Update 2025: Namami Gange Phase II launched with AI-monitored sewage control in 50 cities—but only 9 plants are fully operational.
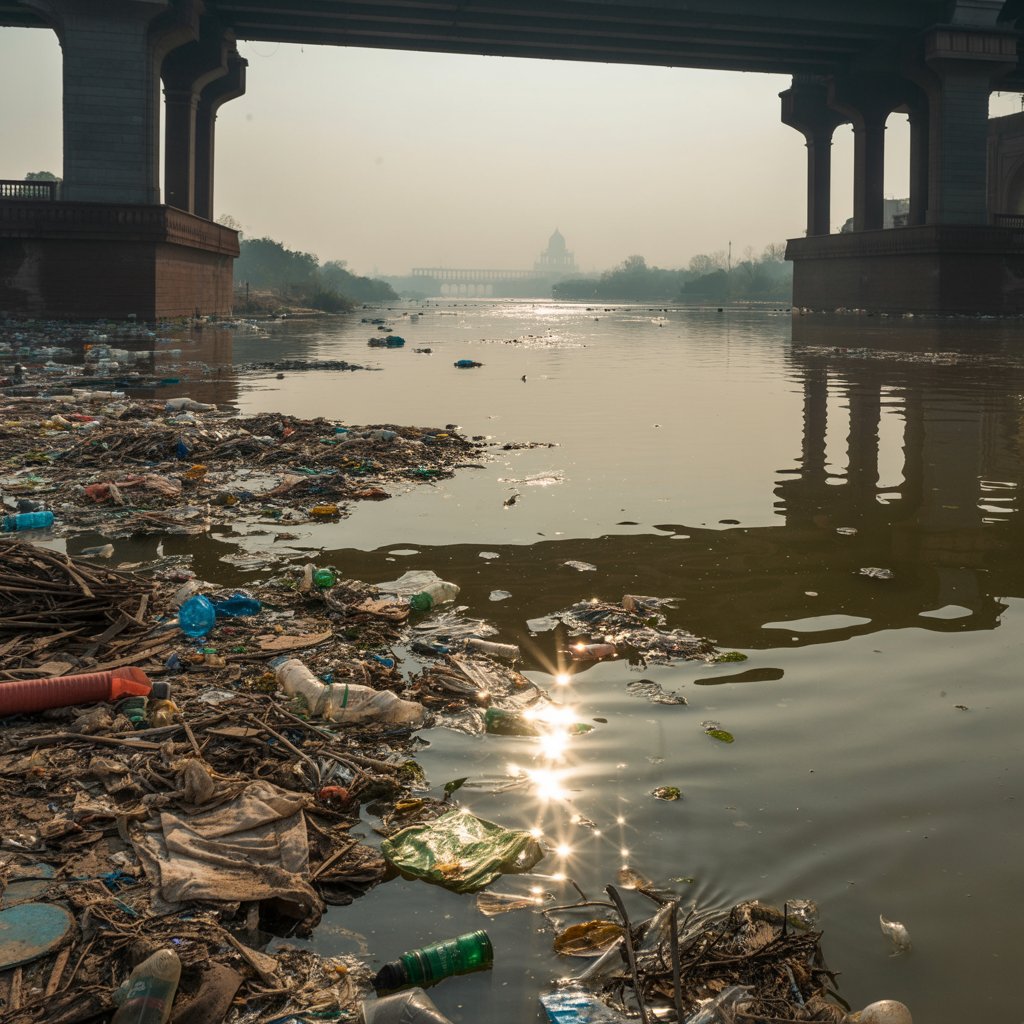
3. Yamuna River – India
- Length: 1,376 km
• Main Pollutants: Surfactants, heavy metals, nitrogen-rich waste
• Source: Urban sprawl and underperforming sewage plants in Delhi
• Affected Areas: Delhi, Agra, Mathura
• Impact: Toxic foam disrupts Chhath Puja and immersions; Delhi’s drinking water depends on heavily chlorinated Yamuna intakes
• Historical Note: Sacred in Hindu mythology, linked to Lord Krishna
• Notable Fact: Experts estimate over 90% of Yamuna’s pollution is from untreated domestic sewage
Update 2025: The Delhi Jal Board announced ₹1,200 crore in foam-control measures, but riverbank encroachment complicates clean-up.
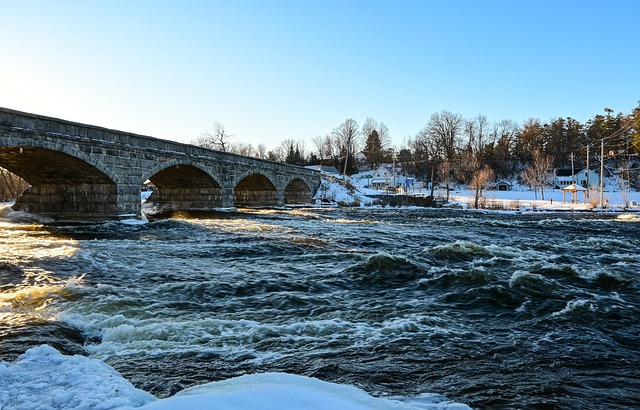
4. Mississippi River – United States
- Length: 3,730 km
• Main Pollutants: Nitrates, herbicides (like atrazine), microplastics
• Source: Agricultural runoff from the Corn Belt and industrial discharge
• Affected Areas: Minneapolis, Memphis, Baton Rouge, New Orleans
• Impact: A 6,300-square-mile dead zone in the Gulf of Mexico; private wells contaminated in over 140 rural counties
• Historical Note: The economic spine of 19th-century America—now a corridor of chemical factories
• Notable Fact: The region dubbed “Cancer Alley” has 50x higher cancer risk due to waterborne toxins
Update 2025: Federal funds from the Farm Bill support “precision fertilization” tech, but uptake remains under 30%.
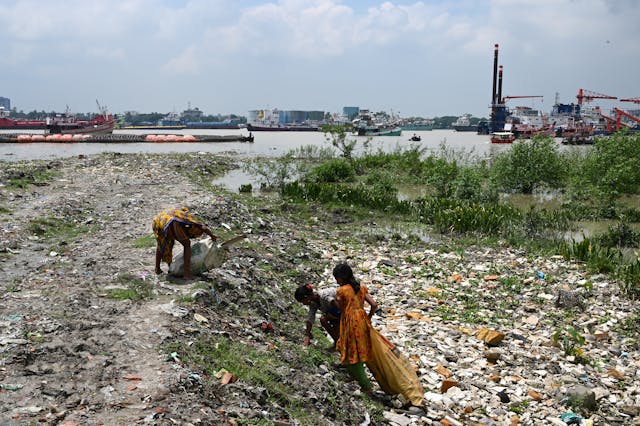
5. Buriganga River – Bangladesh
- Length: 27 km
• Main Pollutants: Chromium, untreated sewage, plastic bags
• Source: Tanneries and textile industries in Old Dhaka
• Affected Areas: Kamrangirchar, Keraniganj, Sadarghat
• Impact: Reports of open wounds failing to heal; residents spend 40% of income on bottled water
• Historical Note: Once known as the “lifeline of Dhaka” for ferry transport and trade
• Notable Fact: A 2024 report found no dissolved oxygen in 80% of Buriganga’s lower stretches
Update 2025: Tannery relocation to Savar was meant to help—but new treatment plants there remain offline.
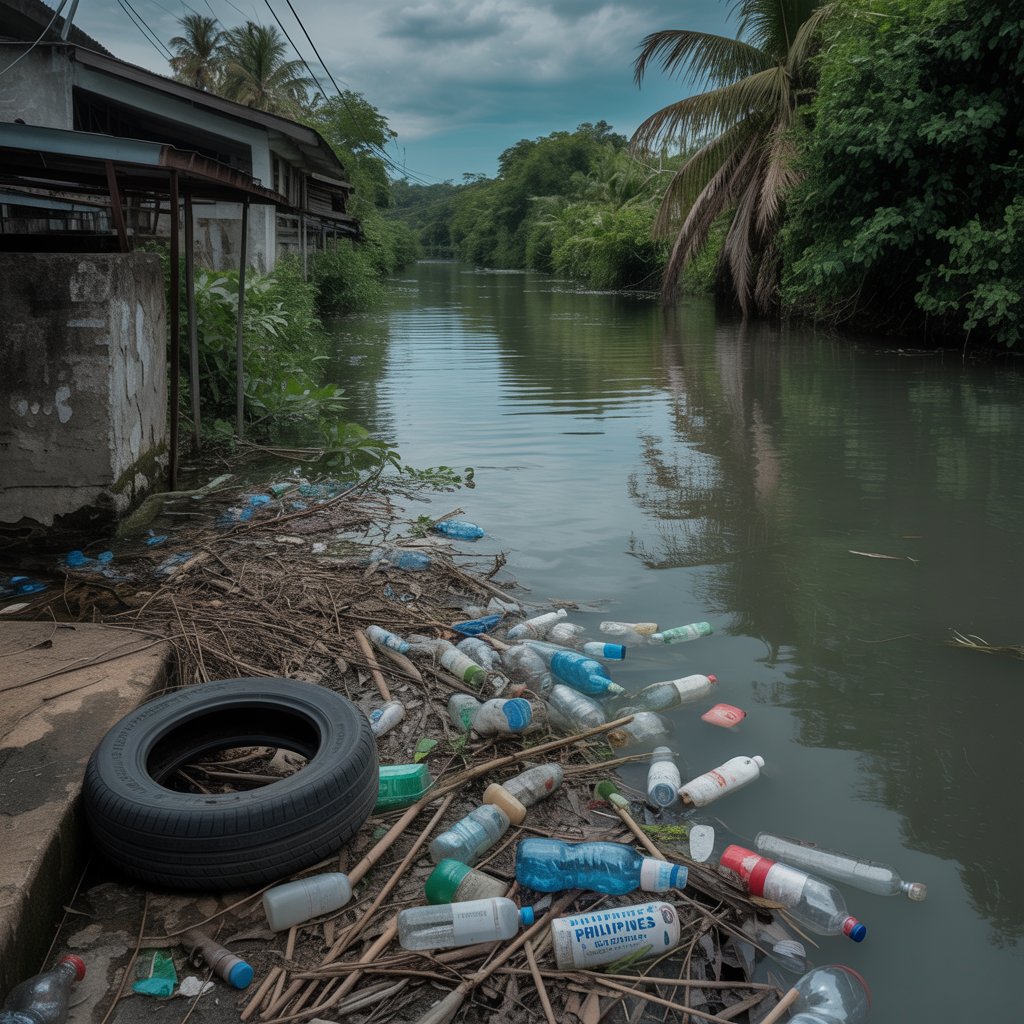
6. Marilao River – Philippines
- Length: 27 km
• Main Pollutants: Arsenic, cyanide, battery acid residues
• Source: Electronics recycling, gold processing, domestic waste
• Affected Areas: Bulacan, Meycauayan, downstream Manila neighborhoods
• Impact: Cancer rates spiking among children; crops irrigated with river water exceed allowable metal residue
• Historical Note: Once used for aquaculture and farming
• Notable Fact: Labeled “biologically dead” by DENR in 2010—and status hasn’t changed
Update 2025: Local non-profits distribute arsenic test kits, but illegal gold extraction continues unabated.
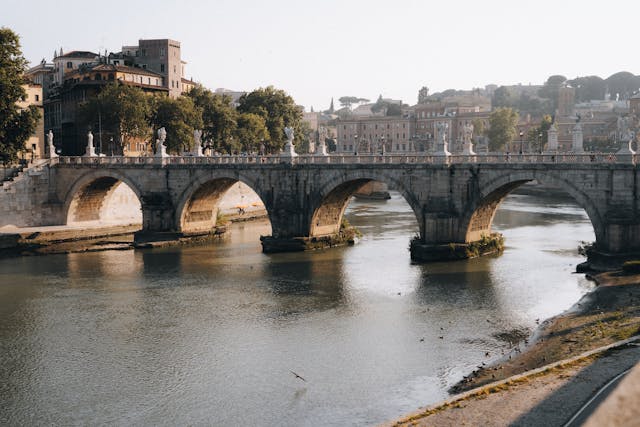
7. Sarno River – Italy
- Length: 24 km
• Main Pollutants: Untreated sewage, agrochemicals, lead
• Source: Runoff from farms, towns, and manufacturing near Mount Vesuvius
• Affected Areas: Pompeii, Scafati, Torre Annunziata
• Impact: Contamination reaching UNESCO marine sites; decline in shellfish safety certifications
• Historical Note: Once a crucial trade route in Roman times
• Notable Fact: Contains antibiotic-resistant bacteria linked to hospital discharge
Update 2025: New €180M pipeline project aims to reroute sewage—but delays persist due to archaeological site disruptions.
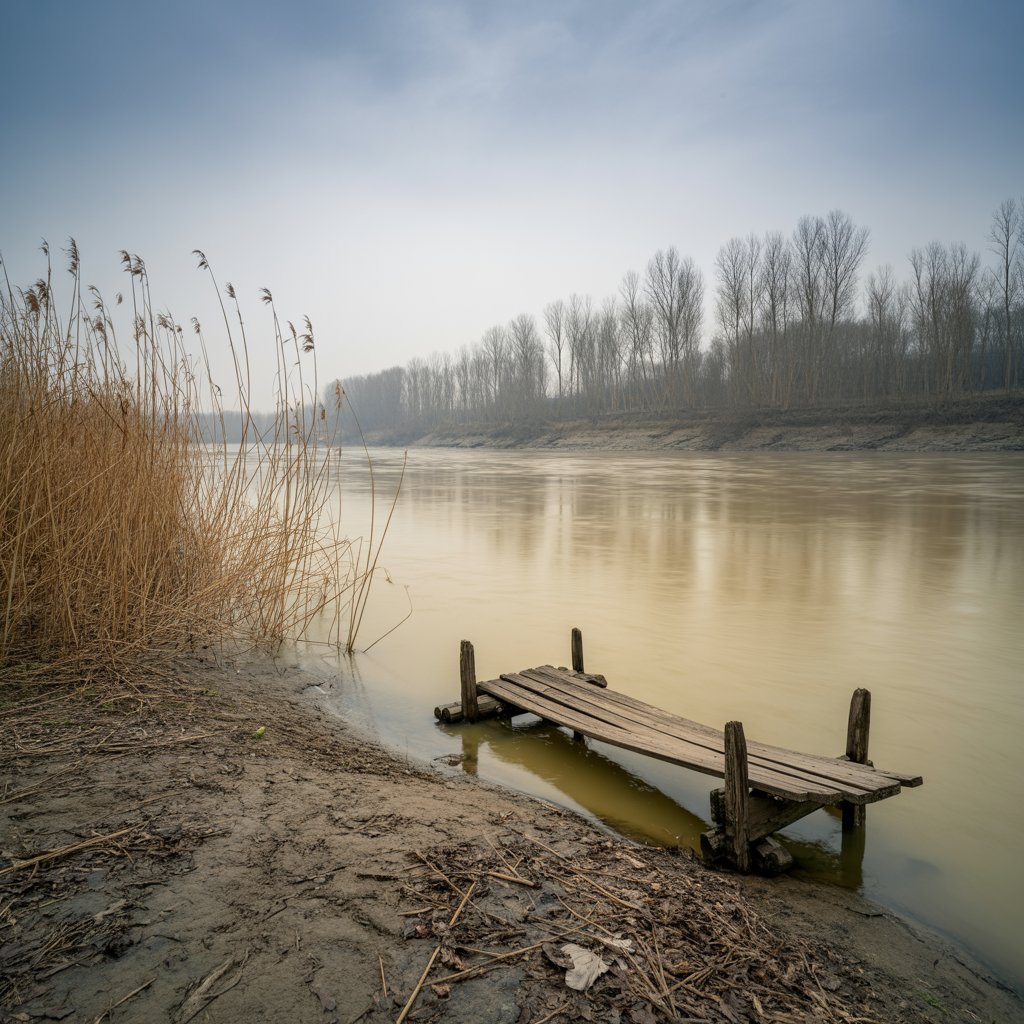
8. Yellow River – China
- Length: 5,464 km
• Main Pollutants: Petrochemicals, ammonia, fertilizers
• Source: Coal plants, oil fields, large-scale farms
• Affected Areas: Lanzhou, Zhengzhou, Shandong, Henan
• Impact: “Cancer villages” documented by Chinese NGOs; 10 million people lack access to potable water
• Historical Note: Once called “the cradle of Chinese civilization”; prone to deadly historical floods
• Notable Fact: One-third of sampled stretches contain zero classifiable water under national standards
Update 2025: AI monitoring drones now used on 200 km segments—but corruption hinders response.
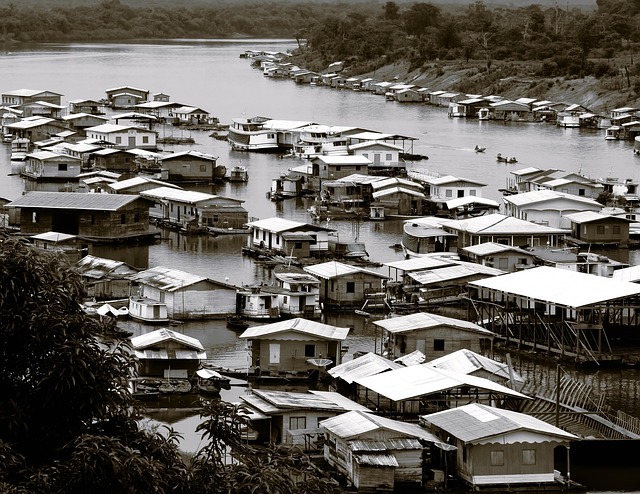
9. Tiete River – Brazil
- Length: 1,150 km
• Main Pollutants: Domestic sewage, detergents, pharmaceutical waste
• Source: Overflow from São Paulo’s metro sprawl
• Affected Areas: São Paulo, Pirapora do Bom Jesus, Salto
• Impact: Algae blooms block city outfalls; fish kills reported during El Niño-linked low flow
• Historical Note: Vital for São Paulo’s development and hydroelectric generation
• Notable Fact: A massive foam incident in 2023 shut down 3 wastewater plants for 10 days
Update 2025: SABESP’s cleanup now covers 60% of upstream discharge, but downstream neglect remains high.

10. Jordan River – Middle East
- Length: 251 km
• Main Pollutants: Salts, pathogens, raw sewage
• Source: Water over-extraction, agricultural and urban runoff
• Affected Areas: Sea of Galilee, West Bank, Dead Sea basin
• Impact: Aquifer salinization; water scarcity affecting Palestinian and Jordanian farmers
• Historical Note: Sacred to Christianity, Judaism, and Islam; site of Jesus’ baptism
• Notable Fact: Current flow is just 10% of its historical average
Update 2025: Water diplomacy advances between Israel and Jordan include cross-border wastewater recycling plans—but implementation lags.
What’s Really in These Rivers?
| Pollutant | Source | Effect | Example River |
| Microplastics | Urban runoff, textiles | Enters food chain | Ganges, Marilao |
| Nitrates | Agriculture | Causes algal blooms | Mississippi |
| Chromium | Tannery effluent | Cancer risk | Buriganga |
| Lead | Mining, smelting | Neurotoxic | Citarum |
| Pharmaceuticals | Human waste, hospitals | Hormone disruption | Yamuna |
Scientific Insight: Many of these rivers are “hotspots” for antibiotic-resistant bacteria due to untreated human waste mixing with drug residues.
The Human Toll: Health, Poverty & Pollution
Across continents, polluted rivers have become silent killers. While they once sustained civilizations, today they are a source of disease, poverty, and displacement. Here’s how communities along the world’s most polluted rivers are suffering in 2025:
India – Ganges & Yamuna Rivers
The Ganges and Yamuna are not only sacred rivers but also lifelines for over 500 million people. Yet their waters are increasingly toxic:
- Over 100,000 people die annually from diseases like cholera, typhoid, and hepatitis linked to Ganges and Yamuna pollution.
- Children suffer disproportionately, with high rates of stunted growth due to waterborne infections.
- In urban slums near Delhi, residents report chronic skin diseases and eye infections from exposure to foam-laced Yamuna waters.
- Farmers irrigating crops with river water risk contaminating their produce with heavy metals and fecal bacteria.
Bangladesh – Buriganga River
The Buriganga, flowing through Dhaka, is among the shortest yet deadliest rivers:
- A recent survey found that 70% of residents in riverside informal settlements suffer from respiratory illnesses and skin rashes.
- Open wounds fail to heal in children who play or bathe in the contaminated waters.
- Women report increased urinary and reproductive infections due to washing clothes in the toxic river.
- Tannery workers handling untreated waste have elevated risks of cancer and kidney failure.
Indonesia – Citarum River
The Citarum flows through West Java’s industrial heart—and the consequences are catastrophic:
- Villagers downstream suffer from neurological disorders due to chronic exposure to mercury and lead.
- Birth defects have been documented in areas near industrial outflows.
- Fishing communities, once prosperous, are now unemployed and malnourished due to aquatic extinction.
- Locals live without access to safe drinking water—even rainwater is polluted by airborne chemical residues.
United States – Mississippi River
While the Mississippi is not as visibly toxic, it quietly contributes to long-term health issues:
- Cancer Alley, a stretch between Baton Rouge and New Orleans, has cancer rates 50 times higher than the national average—linked to chemical industries along the river.
- Rural communities suffer from nitrate-contaminated wells, which contribute to “blue baby syndrome” and reproductive issues.
- Indigenous groups in the Midwest fight for access to uncontaminated water as fish stocks decline.
Philippines – Marilao River
The Marilao River, choked with heavy metals, poses grave health hazards:
- Elevated levels of arsenic and cadmium have been found in residents’ bloodstreams.
- Farmers irrigating fields with river water unknowingly poison their crops, affecting food security.
- Children born near the river have higher risks of low birth weight and developmental delays.
- Many families can’t afford bottled water and rely on contaminated hand-dug wells.
Italy – Sarno River
In the shadow of ancient Pompeii, the Sarno River threatens modern lives:
- Sewage-infused waters result in gastric and intestinal diseases, especially during summer.
- Coastal fishermen in the Bay of Naples report economic ruin as fish and shellfish populations plummet.
- Waste from towns along the river leads to mosquito infestations, causing rising dengue and malaria-like illnesses.
China – Yellow River
The Yellow River—once the “Mother River” of China—is now a source of health anxiety:
- In Shandong Province, over 30% of wells tested near the river exceed safe levels for nitrates and industrial solvents.
- Villages report high rates of cancer clusters, particularly in regions downstream from coal and chemical plants.
- Farmers are forced to use contaminated water for irrigation, raising concerns about food safety and export bans.
- Migrant workers in industrial cities live in poor sanitation zones, increasing the spread of infectious diseases.
Brazil – Tiete River
Running through São Paulo, the Tiete River impacts urban and rural populations alike:
- In river-adjacent favelas, children suffer frequent dermatitis, eye infections, and respiratory illnesses.
- The stench of untreated sewage reduces air quality, leading to chronic asthma and absenteeism from school.
- Fish once caught for food and income now carry dangerous levels of pharmaceuticals and detergents.
- Residents report mental stress and depression due to living conditions near the toxic riverbanks.
Middle East – Jordan River
The Jordan River, though small, is crucial in a politically tense region:
- Its 90% reduced flow has led to increased salinity and water scarcity in Palestine, Jordan, and Israel.
- Disputes over water access have worsened inequality and conflict, particularly in refugee communities.
- Poor communities near the lower Jordan use polluted river water for crops, resulting in gastrointestinal infections and reduced yields.
- Eco-tourism and pilgrimage—once a key economic activity—has declined, straining local livelihoods.
Women and Children Hit Hardest
Across all 10 regions, women and children are affected the most:
- Women do domestic water chores and get directly exposed to toxic water.
- Children are exposed during play, bathing, or helping parents with laundry and agriculture.
- Without safe alternatives, families prioritize drinking water over hygiene and disease transmission worsens.
- Educational attainment suffers as sick children miss school and girls drop out to help with water collection or sick family members.
“Water is life—but for many living near these rivers, it’s a slow killer.”
— Dr. Anika Rahman, Environmental Health Specialist

Are We Making Progress?
Yes—but unevenly.
Good News:
- Thames River (UK) was once called “biologically dead” is now swimmable.
- Rhine River (Germany) saw fish return after decades of pollution.
- Hudson River (USA) has ongoing PCB cleanup after years of advocacy.
Challenges:
- Funding gaps
- Weak enforcement
- Political instability
- Climate-exacerbated droughts
Map Suggestion: Active river restoration efforts worldwide (2025 overlay)
What’s Killing Our Rivers?
Rivers are resilient, living systems — but even they have limits. Across the globe, rivers are being pushed to the brink by a toxic mix of industrial, agricultural, and domestic stressors. Here’s what’s driving the decline:
1. Industrial Waste: Unfiltered Toxins Flowing Freely
- In many developing economies, rivers serve as open sewers for industry.
- Wastewater from textile factories, tanneries, mining, oil refining, and chemical plants enters rivers without treatment.
- Heavy metals like lead, chromium, and mercury bioaccumulate, poisoning fish, soil, and people.
- Example: Over 50% of factories along Indonesia’s Citarum River dump directly into the water without a license.
2. Agricultural Runoff: Nitrates, Pesticides & Pathogens
- Excessive use of synthetic fertilizers and pesticides washes off into river systems, especially during rains.
- This causes eutrophication, where algae blooms suck oxygen out of the water and create dead zones.
- Animal waste from mega-dairies and pig farms also introduces dangerous bacteria like E. coli and salmonella.
- Example: The Mississippi River delivers so much nitrogen to the Gulf of Mexico that it triggers a dead zone the size of New Jersey each summer.
3. Domestic Sewage: Open Defecation & Broken Infrastructure
- In many cities, raw sewage flows directly into rivers due to old, leaky, or nonexistent treatment systems.
- Cities like Delhi, Dhaka, and Manila treat less than 30% of their wastewater.
- Combined with stormwater, this floods rivers with pathogens, pharmaceuticals, and microplastics.
- Example: The Yamuna River in India receives more than 800 million liters of untreated sewage per day from Delhi alone.
️ 4. Plastic Pollution: Rivers as Highways to the Ocean
- Rivers carry 90% of ocean-bound plastic waste, according to The Ocean Cleanup.
- Single-use packaging, plastic bags, and synthetic fibers from laundry enter storm drains and end up in rivers.
- Microplastics, invisible to the eye, are now found in river sediment, fish flesh, and even human blood.
- Example: The Pasig River (Philippines) was found to transport over 60,000 tons of plastic annually, making it one of the world’s worst offenders.
5. Over-Extraction: Rivers Running Dry Before Reaching the Sea
- Water is being removed from rivers for irrigation, industry, and urban consumption faster than it can be replenished.
- This lowers flow rates, concentrates pollutants, and causes entire sections of rivers to vanish during dry seasons.
- Example: The Jordan River’s flow has dropped by 90% since the 1960s, and it now barely reaches the Dead Sea.
️ 6. Climate Change: Drought, Floods & Warming Water
- Rising temperatures increase water evaporation and reduce natural flow levels.
- Intense rainfall causes more urban runoff and sewer overflow, especially in cities with outdated infrastructure.
- Warmer water holds less oxygen, speeding up aquatic collapse.
- Example: The Rhine and Danube have both recorded historically low water levels, disrupting shipping and fish migration.
7. Emerging Contaminants: A New Class of Threats
- Rivers are now carrying antibiotics, hormones, microbeads, and nanoplastics — substances never designed to enter ecosystems.
- These pollutants interfere with fish reproduction, promote antibiotic resistance, and alter food chains.
- Example: Researchers found 32 pharmaceuticals in a single sample from the Tietê River in Brazil.
Rivers don’t die overnight. They die from a thousand daily abuses — each pipe that leaks, each field that drains, each bag that floats. Without collective recognition of these root causes, even the best technologies and treaties will fail.
That’s why the next section — “Solutions: How We Can Clean Our Rivers” — is not just helpful.
It’s urgent.
Solutions: How We Can Clean Our Rivers
Polluted rivers aren’t beyond repair — history shows that even the most toxic waterways can rebound with targeted action, community involvement, and sustained funding. Below is a comprehensive look at how global actors, governments, and citizens can collaborate to reverse the damage.
Technology & Innovation: Smarter, Faster Water Protection
Modern tools are helping us detect, monitor, and reduce river pollution in ways that were unimaginable a decade ago.
AI-Driven Water Quality Monitoring
- Real-time sensors powered by AI and machine learning are now deployed along rivers like the Ganges and Yellow River to detect levels of BOD (biochemical oxygen demand), pH, nitrates, and heavy metals.
- These systems generate alerts to local authorities when pollution spikes, allowing for rapid response.
- Example: China’s Smart River Surveillance Program in 2025 tracks pollution via drones and riverbuoys across 200 km of the Yellow River.
Floating Trash Interceptors
- Devices like The Interceptor® (by The Ocean Cleanup) and Litter Gitter systems are installed in cities like Jakarta, Manila, and Bangkok to collect up to 50 tons of floating plastic per week.
- These solar-powered devices prevent plastic from reaching oceans and improve surface water conditions dramatically within months.
Green Infrastructure for Urban Areas
- Cities like Portland, USA and Melbourne, Australia have adopted bioswales, rain gardens, and artificial wetlands that filter runoff before it reaches rivers.
- A study by the US EPA found green infrastructure can reduce urban runoff pollutants by 70–90%.
- In São Paulo, pilot projects now aim to green 15 km of concrete canals feeding into the Tietê River.
Bioremediation and Native Plants
- In some rivers (like India’s Yamuna), native wetland plants like water hyacinth and vetiver grass are used in floating gardens to absorb toxins.
- These methods are low-cost, scalable, and enhance biodiversity while lowering chemical concentrations.
Policy & Collaboration: Governance Is the Backbone
Technological tools alone aren’t enough. Without strong governance, enforcement, and international cooperation, rivers will remain vulnerable.
Cross-Border River Basin Treaties
- Many rivers, including the Jordan, Nile, Mekong, and Danube, cross national boundaries. Regional treaties and water-sharing frameworks are essential.
- Example: The UN Convention on the Law of the Non-Navigational Uses of International Watercourses helps mediate water use across 37 countries.
Bans on Single-Use Plastics
- As of 2025, 94 countries have introduced partial or full bans on plastic bags, straws, and cutlery.
- The EU’s 2022 ban has led to a 23% drop in riverine plastic debris in monitored sites across Italy, France, and Spain.
Community-Led Waste Management
- In India, over 100,000 “Ganga Grams” (village volunteers) monitor plastic use, segregate waste, and conduct riverbank cleanups.
- In Bangladesh, river watch NGOs now partner with slum councils to build floating plastic booms and teach basic water testing.
Environmental Accountability Laws
- Countries like the Philippines and Indonesia now enforce “polluter pays” principles where industries exceeding waste limits face steep fines.
- The US Clean Water Act (amended in 2024) now requires all facilities near rivers to publish pollutant discharge data in public dashboards.
Global Funding: Without Financing, Efforts Fail
Cleaning rivers is costly. But economic analysis shows the returns are far greater than the investment.
Green Climate Fund & Global Commitments
- In 2024, the Green Climate Fund (GCF) allocated $14 billion to freshwater and sanitation infrastructure across 32 countries, targeting rivers in Southeast Asia and Sub-Saharan Africa.
- The UN Water Action Decade (2018–2028) calls for tripling global investment in water and wastewater treatment by 2030.
World Bank & Regional Grants
- The World Bank’s Clean Rivers Program (2025 edition) focuses on industrial zones in Indonesia, offering low-interest loans for eco-compliant factory retrofits.
- In Latin America, the Amazon River Basin Trust has funded $600 million for native vegetation buffers along polluted tributaries.
Public-Private Partnerships (PPPs)
- In São Paulo, the Tiete River Recovery Consortium now combines corporate sponsorship (e.g., Nestlé, SABESP) with government cleanup targets.
- Similar models are emerging in the Philippines, with electronics manufacturers co-funding Marilao’s waste segregation zones.
Economic Rationale for Action
- UNEP reports that every $1 invested in river cleanup returns $4–$7 in avoided health costs, tourism growth, and agricultural productivity.
- For example, the revitalization of the Thames River in London boosted waterfront property values by 12% and increased tourism by 25% over 10 years.
Behavioral Change & Education
Lasting change comes when citizens are informed and motivated.
- Schools in Ghana and Indonesia now include river literacy in their national science curriculum.
- Digital campaigns like #MyRiverMyResponsibility and “Adopt-a-River” are gaining traction in over 40 countries.
- Mobile apps (like mWater or RiverWatch) let users report pollution or illegal dumping in real-time.
It’s Doable—But Requires All Hands on Deck
Cleaning the world’s most polluted rivers requires an integrated approach:
- Technology to detect and intercept pollutants
- Policy enforcement to hold polluters accountable
- Funding to build treatment infrastructure
- Community engagement to maintain momentum
We’ve seen rivers come back from the brink — the Thames, the Rhine, and parts of the Hudson are cleaner than they’ve been in 100 years. The same is possible for the Ganges, Citarum, Buriganga, and beyond — if we act boldly, collectively, and now.
Final Thoughts: A Global Wake-Up Call
Rivers have nurtured humanity for thousands of years. Today, they’re choking under our waste, plastic, and negligence. While cleanup is possible—as success stories in Europe show—it takes urgency, investment, and international cooperation.
We’re running out of time. These rivers may not have a voice—but their toxic silence should scream louder than words.
❓FAQs: Most Polluted Rivers in the World
Q1. What is the most polluted river in the world today?
The Citarum River in Indonesia holds the top spot in 2025 due to extreme industrial waste and toxic chemicals.
Q2. What are the main causes of river pollution globally?
The top causes are untreated sewage, industrial effluents, agricultural runoff (nitrates/pesticides), and plastic waste.
Q3. Can polluted rivers ever be restored?
Yes. Rivers like the Thames and Rhine have rebounded through strong legislation, investment, and community activism.
Q4. How does river pollution affect humans?
Contaminated water spreads diseases, kills aquatic life, and impacts livelihoods like farming and fishing.
Q5. Which countries are leading in river cleanup efforts?
The UK, Germany, and Netherlands have had notable success, while India and Indonesia have ongoing mega cleanup missions.


