Following up on Jim’s post on the GDP release yesterday, looking at different aspects of economic activity:
Quarterly Indicators
First, ignoring the self-congratulatory remarks of CEA47, consider the level of GDP relative to the 2024H2 trend:
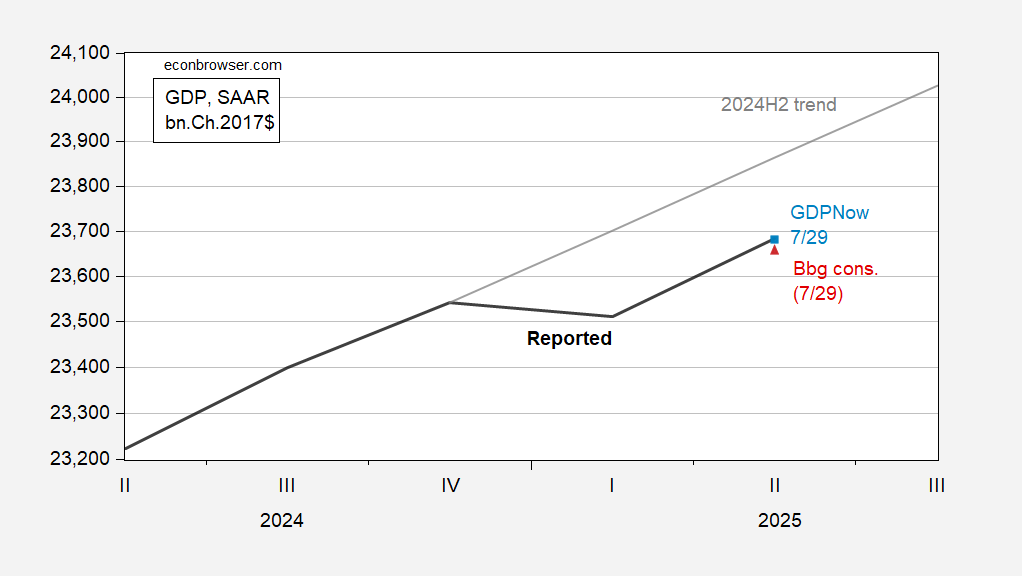
Figure 1: GDP fm Q2 advance (bold black), GDPNow of 7/29 (light blue square), Bloomberg consensus as of 7/29 (red triangle), linear extrapolation using 2024H2 growth rate. Source: BEA, Atlanta Fed, Bloomberg, and author’s calculations.
While the CEA might be buoyed by the 3% which exceeded consensus, it’s clear that 3% did not put GDP on its pre-Trump trajectory. Interestingly, on the day before the release, the Atlanta Fed’s GDPNow was essentially on target at 2.9% vs actual 3.0% y/y annualized (4 days before release, it was at then-consensus of 2.4%).
Given the distortions in GDP associated with tariff frontloading, I think these are times when it’s particularly useful to use final sales to private domestic purchasers (aka “Core GDP”) as a proxy measure for economic momentum. “Final sales” means stripping out the volatile — and difficult to measure — inventory component, while “private domestic purchasers” means excluding net exports and government spending. Here’s the picture of that series relative to nowcasts.
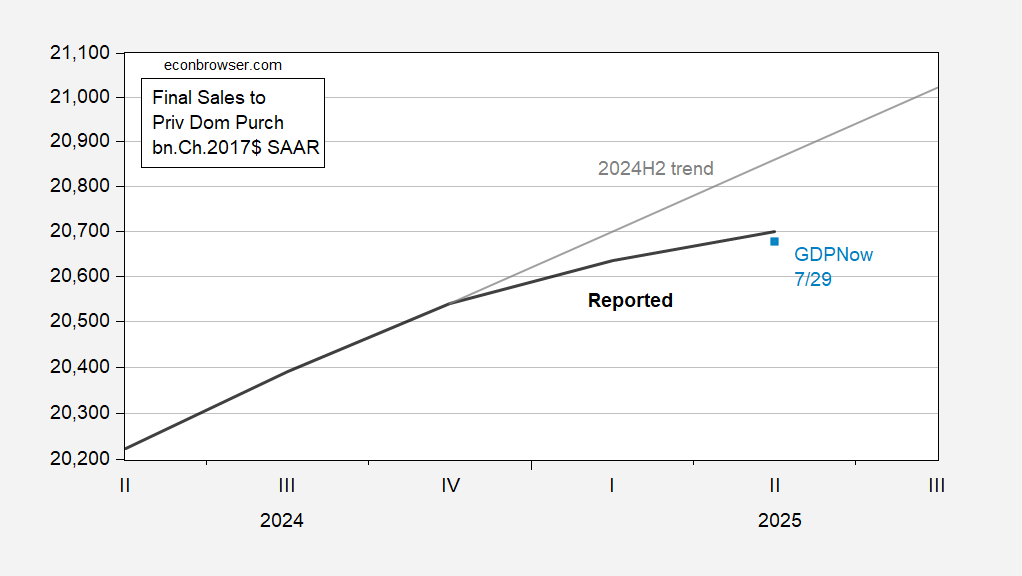
Figure 2: Final sales to private domestic purchasers fm Q2 advance (bold black), GDPNow of 7/29 (light blue square), Bloomberg consensus as of 7/29 (red triangle), linear extrapolation using 2024H2 growth rate. Source: BEA, Atlanta Fed, Bloomberg, and author’s calculations.
Figure 2 makes clear that focusing on this proxy measure for private aggregate demand, while surprising on the upside, is still decelerating (1.8% y/y annualized vs. GDPNow 0.8%, and 3% in 2024H2).
To highlight the point that private domestic purchases is a smoother series than GDP, see Figure 3 regarding the post-Covid period.
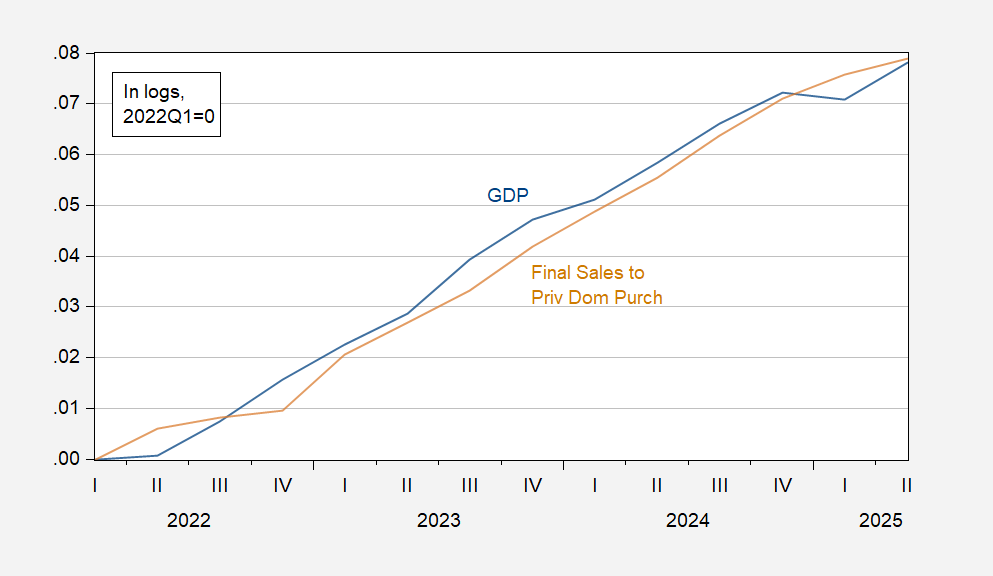
Figure 3: GDP Final sales to private domestic purchasers (bold black), GDPNow of 7/29 (light blue square), Bloomberg consensus as of 7/29 (red triangle), linear extrapolation using 2024H2 growth rate. Source: BEA, Atlanta Fed, Bloomberg, and author’s calculations.
Over this period, the standard deviation of q/q annualized changes for GDP and final sales are 1.5% vs. 1.0%.
What about alternative indicators of aggregate output? We don’t have real GDI for Q2, so we only have GDO through Q1; however we do have implied GDPPlus through Q2, so here’s the picture, along with today’s Atlanta Fed nowcast of Q3 GDP.
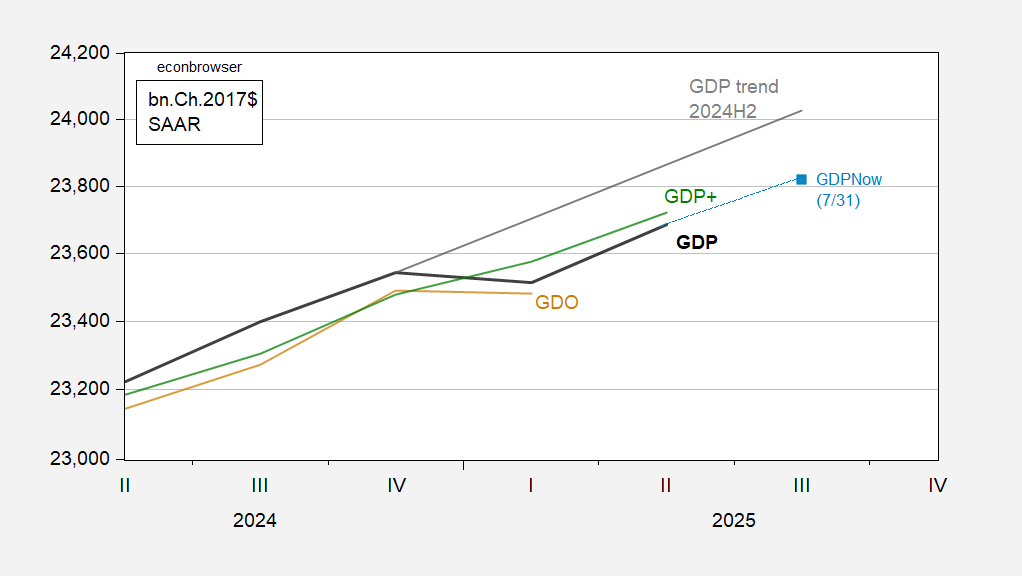
Figure 4: GDP fm Q2 advance (bold black), GDPNow of 7/31 (light blue square), linear extrapolation of GDP using 2024H2 growth rate, GDO (tan), GDP+ based to 2024Q1 (green). Source: BEA, Atlanta Fed, Philadelphia Fed, and author’s calculations.
GDPNow indicates continued growth of 2.3% in Q3, but based on very little information, even though we’re 1/3 of the way through the quarter. Even with this above potential growth rate, the gap between 2024H2 trend and actual GDP will not be closed.
Monthly Indicators
Today’s releases included consumption, personal income for June, and manufacturing and trade industry sales for May. Taking into account anticipated July employment (Bloomberg), we have the following picture of monthly indicators followed by NBER’s Business Cycle Dating Committee (with employment and income the key ones).
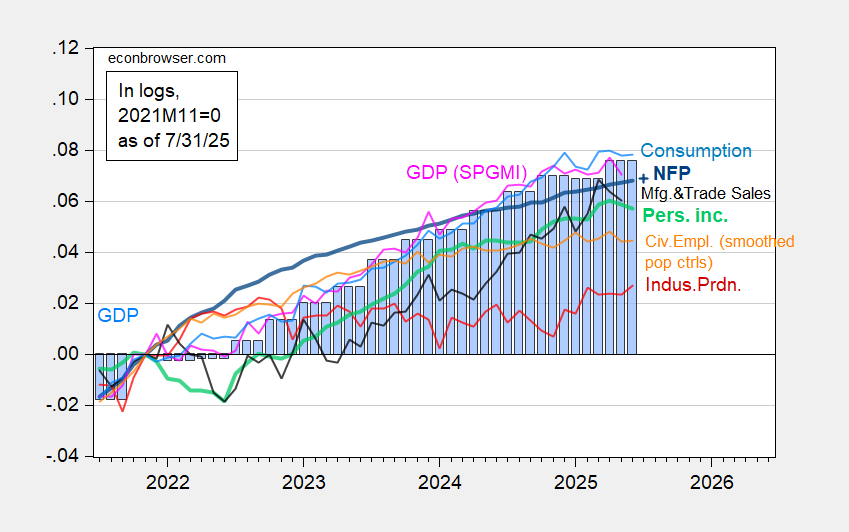
Figure 5: Nonfarm Payroll from CES (bold blue), implied NFP Bloomberg consensus as of 7/30 (blue +), civilian employment with smoothed population controls (orange), industrial production (red), personal income excluding current transfers in Ch.2017$ (bold light green), manufacturing and trade sales in Ch.2017$ (black), consumption in Ch.2017$ (light blue), and monthly GDP in Ch.2017$ (pink), GDP (blue bars), all log normalized to 2021M11=0. Source: BLS via FRED, Federal Reserve, BEA 2025Q2 advance release, S&P Global Market Insights (nee Macroeconomic Advisers, IHS Markit) (7/1/2025 release), and author’s calculations.
Here are some alternative monthly indicators (drawn on same vertical scale as Figure 5):
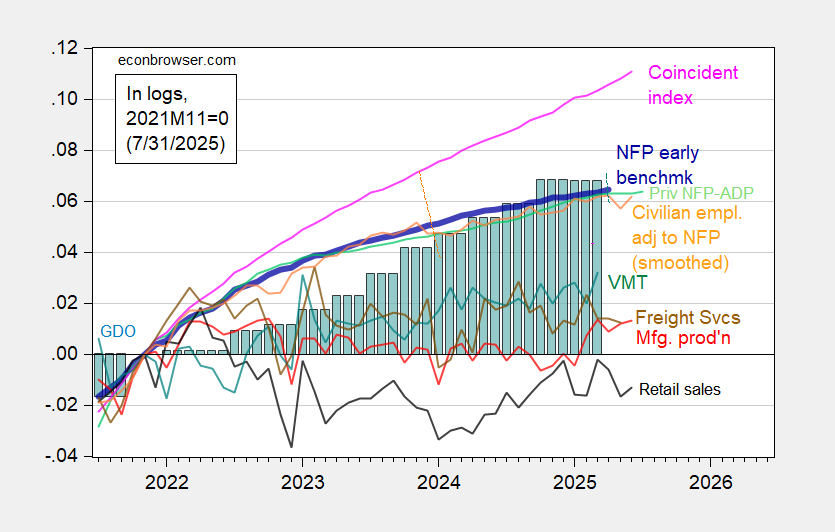
Figure 6: Implied Nonfarm Payroll early benchmark (NFP) (bold blue), civilian employment adjusted to nonfarm payroll concept, with smoothed population controls (orange), manufacturing production (red), vehicle miles traveled (teal), real retail sales (black), and coincident index in Ch.2017$ (pink), GDO (blue bars), all log normalized to 2021M11=0. Source: Philadelphia Fed [1], Philadelphia Fed [2], Federal Reserve via FRED, BEA 2025Q2 advance release, and author’s calculations.
One observation is that real consumption and personal income ex-transfers were flat, and down respectively in June, while the manufacturing and trade industry sales series has continued a downward trend through May. While Bloomberg consensus is for a continued increase in nonfarm payroll employment, ADP’s private NFP series has been essentially flat through June.
Conclusion
Taken all together, it’s hard to see a recession in June’s data (keeping in mind all these observations will be revised), and given the consensus unemployment rate increase of 0.1 percentage points, the Sahm rule will not be triggered (exception, see Michaillat’s post). But clearly the economy looks like it’s entering a period of decelerating growth, perhaps even zero growth on key indicators.


